System Architecture
On top of generating service-level application code, Temple produces orchestration configuration files to enable executing the services together as a whole system. This guide will take you through how a Temple generated application is designed on the super-service level. We'll look at how the system is organised and how it changes with more advanced features.
The details of how the application code in each service is architected can be seen in the Service Architecture reference.
Minimal Example
We'll start with the example Templefile from the Getting Started Guide.
ExampleProject: project {#language(go);#database(postgres);#provider(dockerCompose);}ExampleService: service {foo: string;bar: int;}
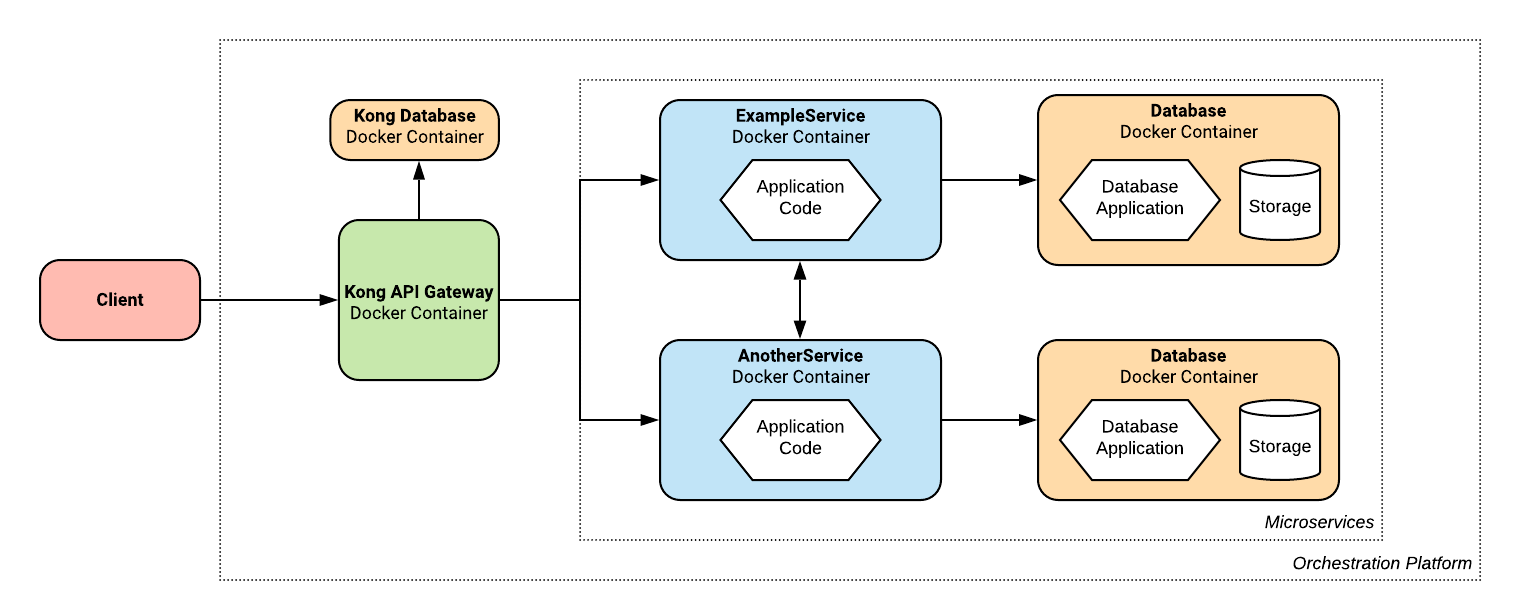
Also from the Getting Started Guide is this diagram outlining the system architecture:
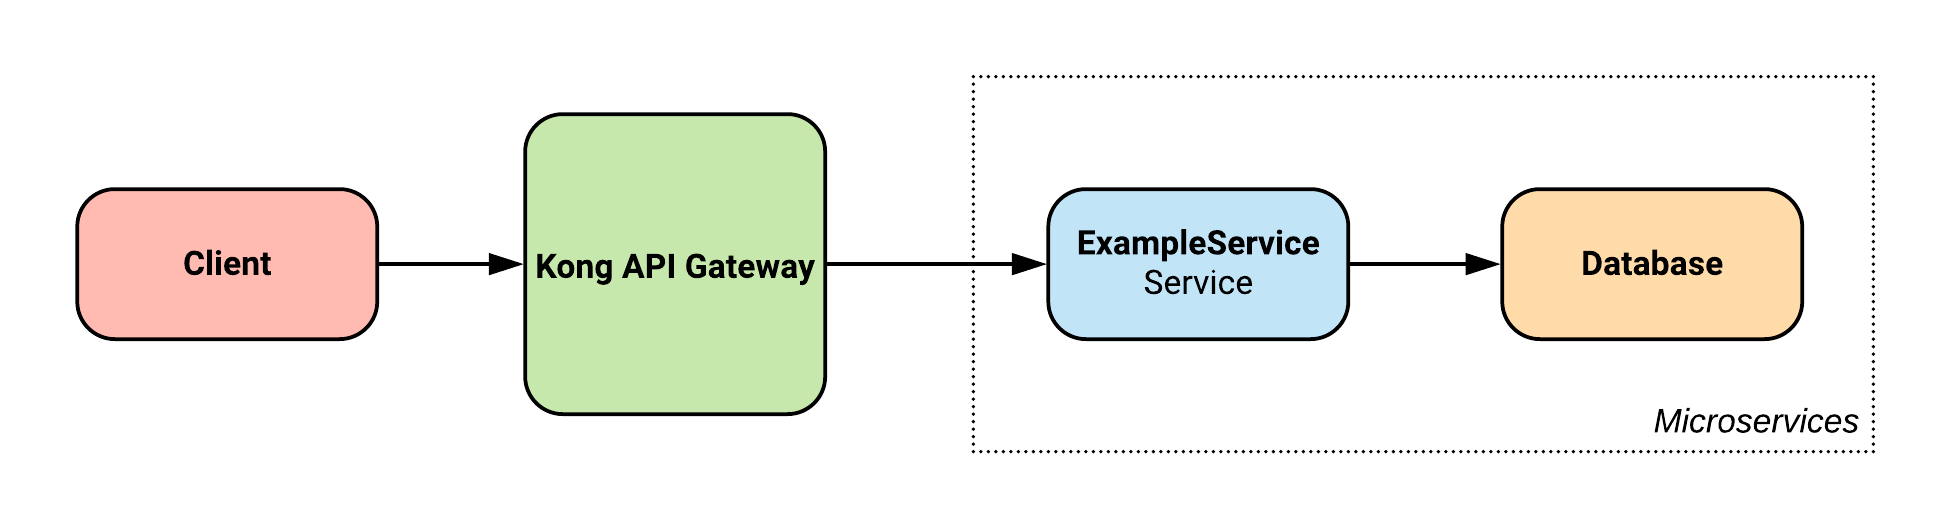
It shows a high level description of the system, detailing how the Kong API Gateway sits between the client and the backend services, and how the service communicates with its database.
Let's delve a little bit deeper into this architecture and see some finer details:
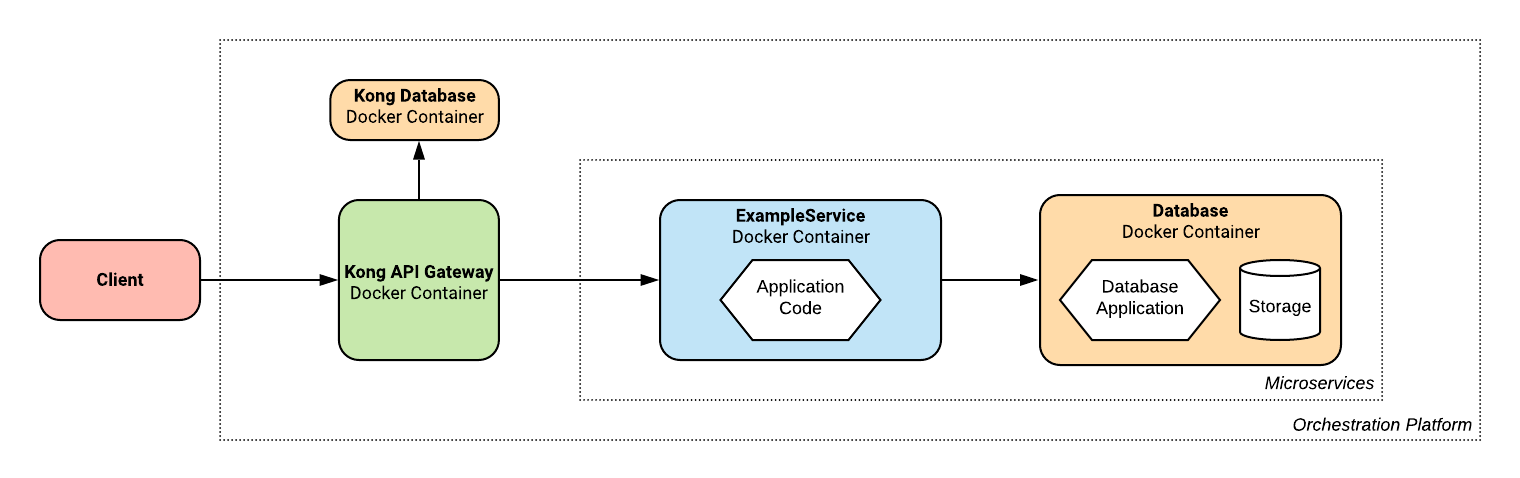
We can see that all components of our application are executed inside of Docker containers, including Kong. This allows us to not have to worry about installing it locally, giving this job to our orchestration tool. Containers allow us to encapsulate our application components and their dependencies, allowing them to be easily ran anywhere, among many other benefits.
We can also see that Kong uses it's own database to store information about which services exist and how to route requests to them.
Like the rest of the Kong infrastructure, this database is orchestrated automatically by Temple.
A PostgreSQL instance sits alongside Kong on a private network, so that only the Kong instance can communicate with it.
All of the components of the system are deployed by the orchestration platform (see the Orchestration guide for full details), however the system architecture can change a little bit based on which platform is chosen.
Docker Compose
Since Docker Compose is a minimal orchestration platform, the architecture doesn't change from what's mentioned above.
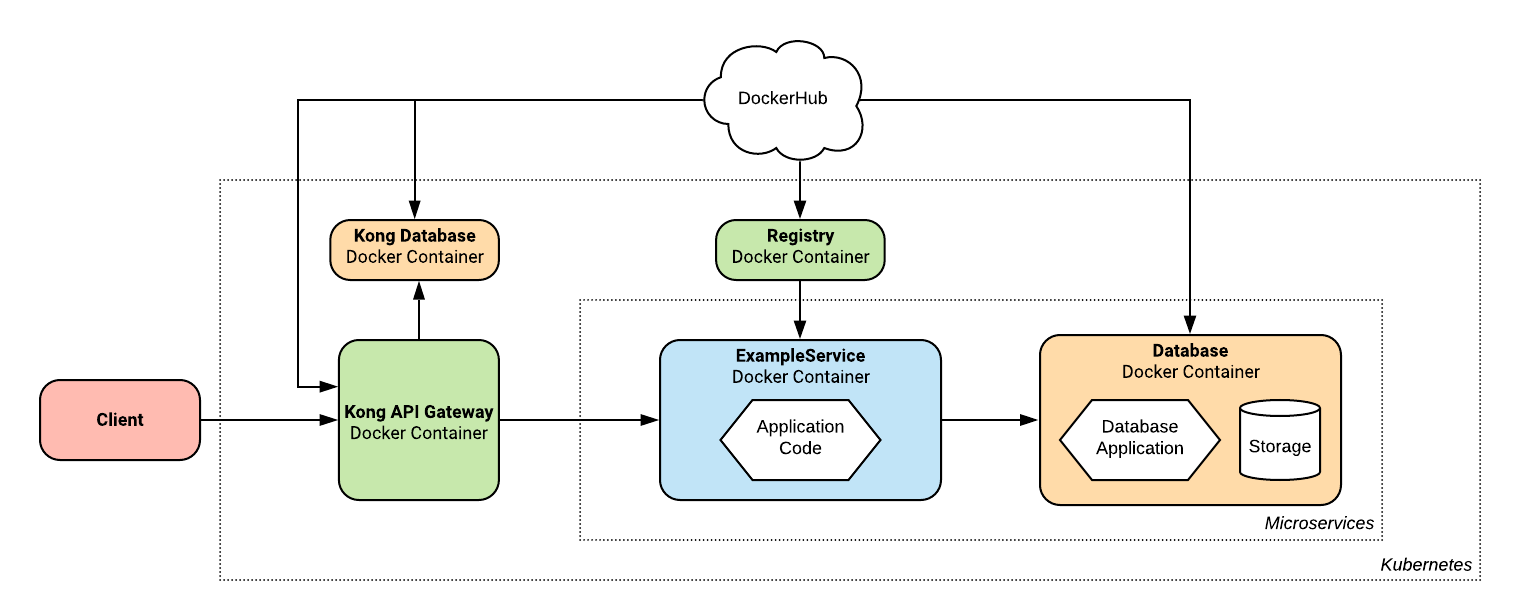
Kubernetes
When Kubernetes is used to orchestrate your platform, all of the Docker images used are required to be stored in a Docker registry. To solve this issue, Temple integrates a registry into the Kubernetes infrastructure, and pushes all of the locally generated application images to it during the deployment process. Third party images like Kong or the Database used are all already stored in public repositories like Docker Hub.
This changes our architecture diagram to look like this:
Extending the basic example
As we add more features to our example Templefile, more infrastructure will be generated to support it.
Foreign Keys
Each additional service added to our Templefile results in an additional replica of the service specific infrastructure components seen above.
Let's add an extra service to our Templefile as an example:
ExampleProject: project {#language(go);#database(postgres);#provider(dockerCompose);}ExampleService: service {foo: string;bar: int;}AnotherService: service {baz: int;}
This results in the following changes to our architecture:

We can see that all of the existing infrastructure that supported ExampleService has been replicated for AnotherService, but everything else remains the same.
We can extend this further by making a Foreign Key reference between services (See the Foreign Keys & Inter-Service Communication guide for full details).
ExampleProject: project {#language(go);#database(postgres);#provider(dockerCompose);}ExampleService: service {foo: string;bar: int;foreignKey: AnotherService;}AnotherService: service {baz: int;}
This has the effect of generating inter-service communication logic in the service-level application code. On the project level, nothing changes, except the services use the hostname resolution of the orchestration platform to make HTTP requests to each other.
Structs
Adding a struct to a service in your Templefile represents two data items that are strongly coupled (see the Structs guide for details). This is implemented in Temple generated projects by extending the parent's application executable to include the additional endpoints required to process struct requests. The struct's data is stored in a separate table of the service's database. This means that when adding structs to your Templefile, the overall system-level architecture doesn't change.
Auth
As per the Authentication guide,
authentication can be added to your system by augmenting your Templefile to include #auth metadata on services, and a #authMethod tag on the project block.
For example:
ExampleProject: project {#language(go);#database(postgres);#provider(dockerCompose);#authMethod(email);}ExampleService: service {foo: string;bar: int;#auth;}
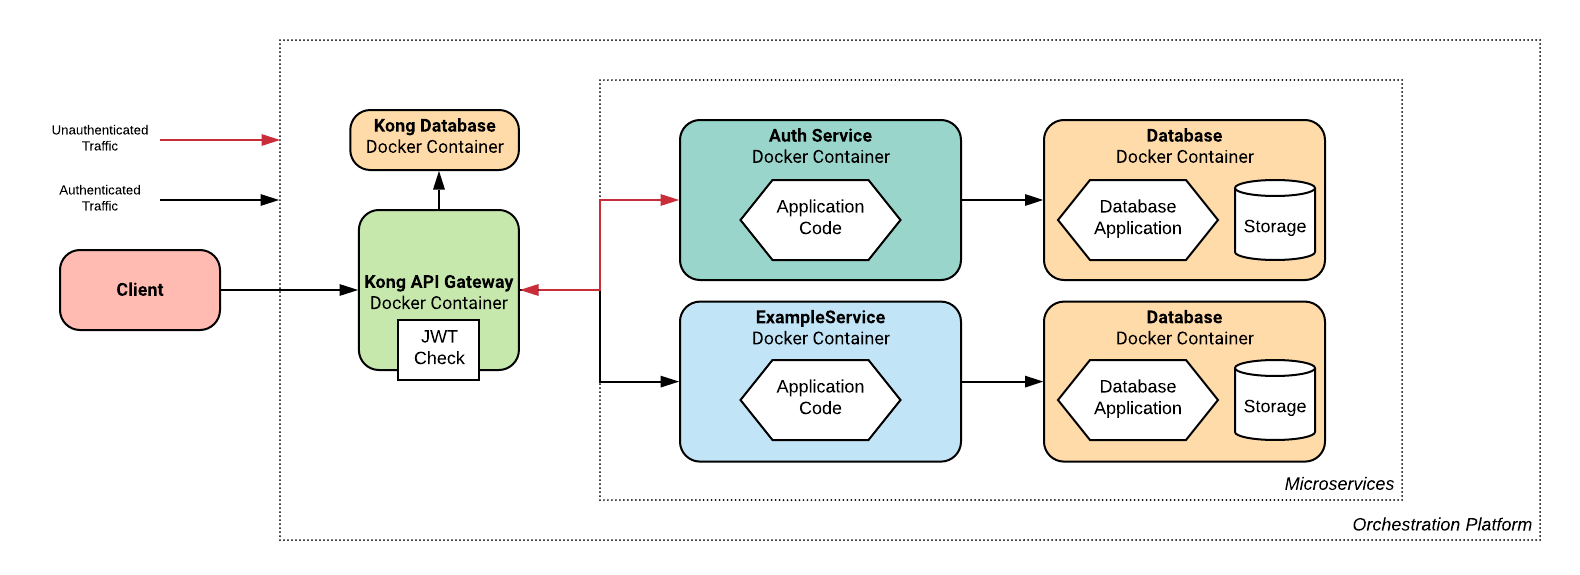
These changes result in an additional Auth service being generated automatically that stores and verifies user credentials, and issues authentication tokens to users for use with other services.
This is implemented by configuring Kong to check that any incoming requests have a valid JWT, except those destined for the auth service.
Any requests that are not correctly authenticated do not pass Kong, so the internal microservices can be sure that all traffic has been correctly authenticated.
Visually, the changes to our architecture look like:
Metrics
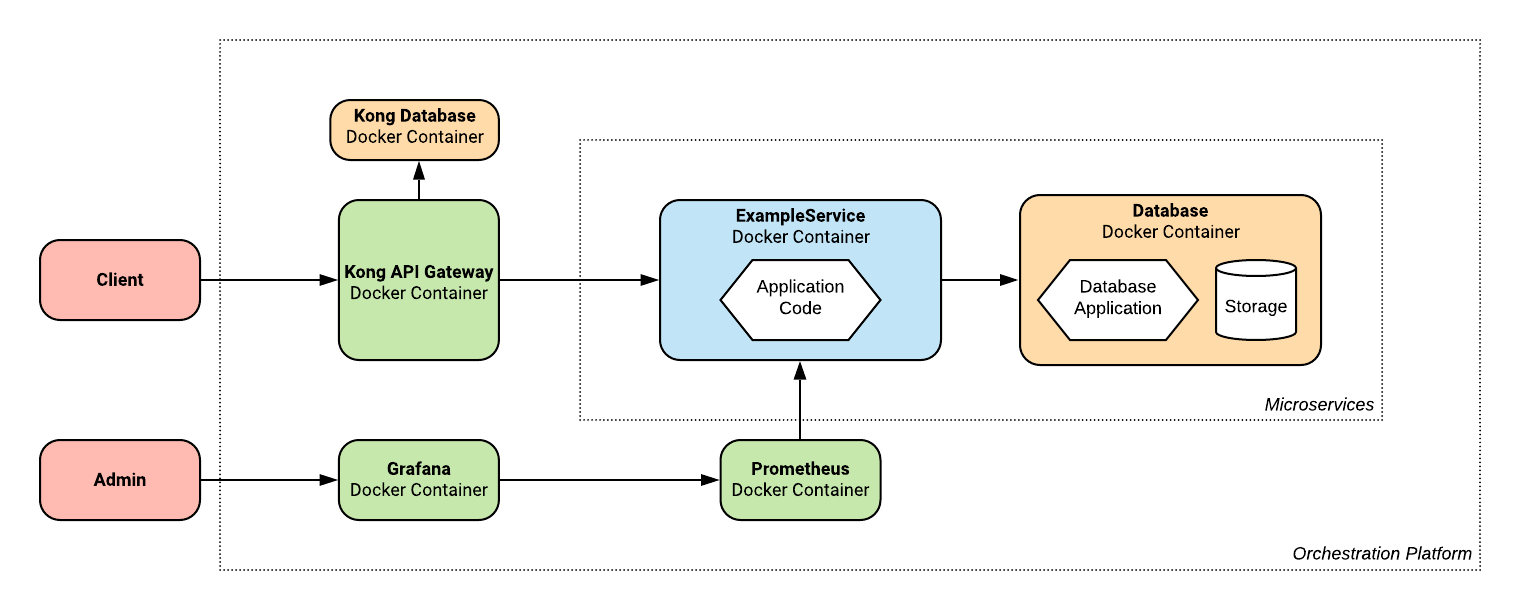
Temple also includes the ability to generate metrics monitoring suites, using Prometheus and Grafana. For full details of their use and implementations, check out the Metrics guide.
Let's add metrics to our example and see how the output changes.
ExampleProject: project {#language(go);#database(postgres);#provider(dockerCompose);#metrics(prometheus);}ExampleService: service {foo: string;bar: int;}
When a project has metrics, two more infrastructure components are needed, a Prometheus instance and a Grafana instance. Prometheus is a tool for aggregating metrics from all your services into one centralised place. Each service contains logic to aggregate metrics about its performance, which are pulled into Prometheus ready for querying. Grafana exposes a HTTP endpoint which allows an administrator to access a dashboard, populated with metrics pulled from Prometheus.
This Grafana endpoint is not intended to be user-facing, so it is not routed through Kong. Instead, the orchestration platform exposes a separate URL that is routed directly to the Grafana instance. No authentication is checked by default, so this endpoint should be kept secret and in a production grade system would be restricted to an internal network only.
Graphically, the architecture now looks like: