Metrics
Being able to extract meaningful metrics is a crucial part of any microservice-oriented system. That's why we've made it easy to add metrics to your Temple project, for you to view quantitative data about successes and failures, as well as latency information.
For this guide, we'll be using the project from the Getting Started guide as our starting point.
Adding Metrics to Your Project
To add metrics to your Temple project, you just need to add a single metadata item to your project:
ExampleProject: project {#language(go);#database(postgres);#provider(dockerCompose);#metrics(prometheus);}ExampleService: service {foo: string;bar: int;}
This indicates that each service in the project will export some metrics to Prometheus, a popular open source monitoring system. Prometheus data is then exposed for visualisation with Grafana. This is currently the only supported metrics configuration that Temple supports.
After regenerating your project, you'll find several new folders have appeared:
.├── grafana│ └── provisioning│ ├── dashboards│ │ ├── dashboards.yml│ │ └── example-service.json│ └── datasources│ └── datasource.yml└── prometheus└── prometheus.yml
These two folders provide the configuration for Grafana and Prometheus, and are mounted into their associated Docker container when it is started. More information about these files can be found in the Grafana Documentation and Prometheus Documentation.
Viewing Metrics
Viewing metrics from your service is very straight forward, first spin up your infrastructure using the provided deployment script:
❯❯❯ source deploy.sh
Then, open localhost:3000 in your browser.
tip
If you're using Kubernetes instead of Docker Compose, you'll want to run the following command, which will open the Grafana dashboard in your browser:
❯❯❯ minikube service grafana
This should present you with the Grafana login window.
The default login is admin for both the username and password:
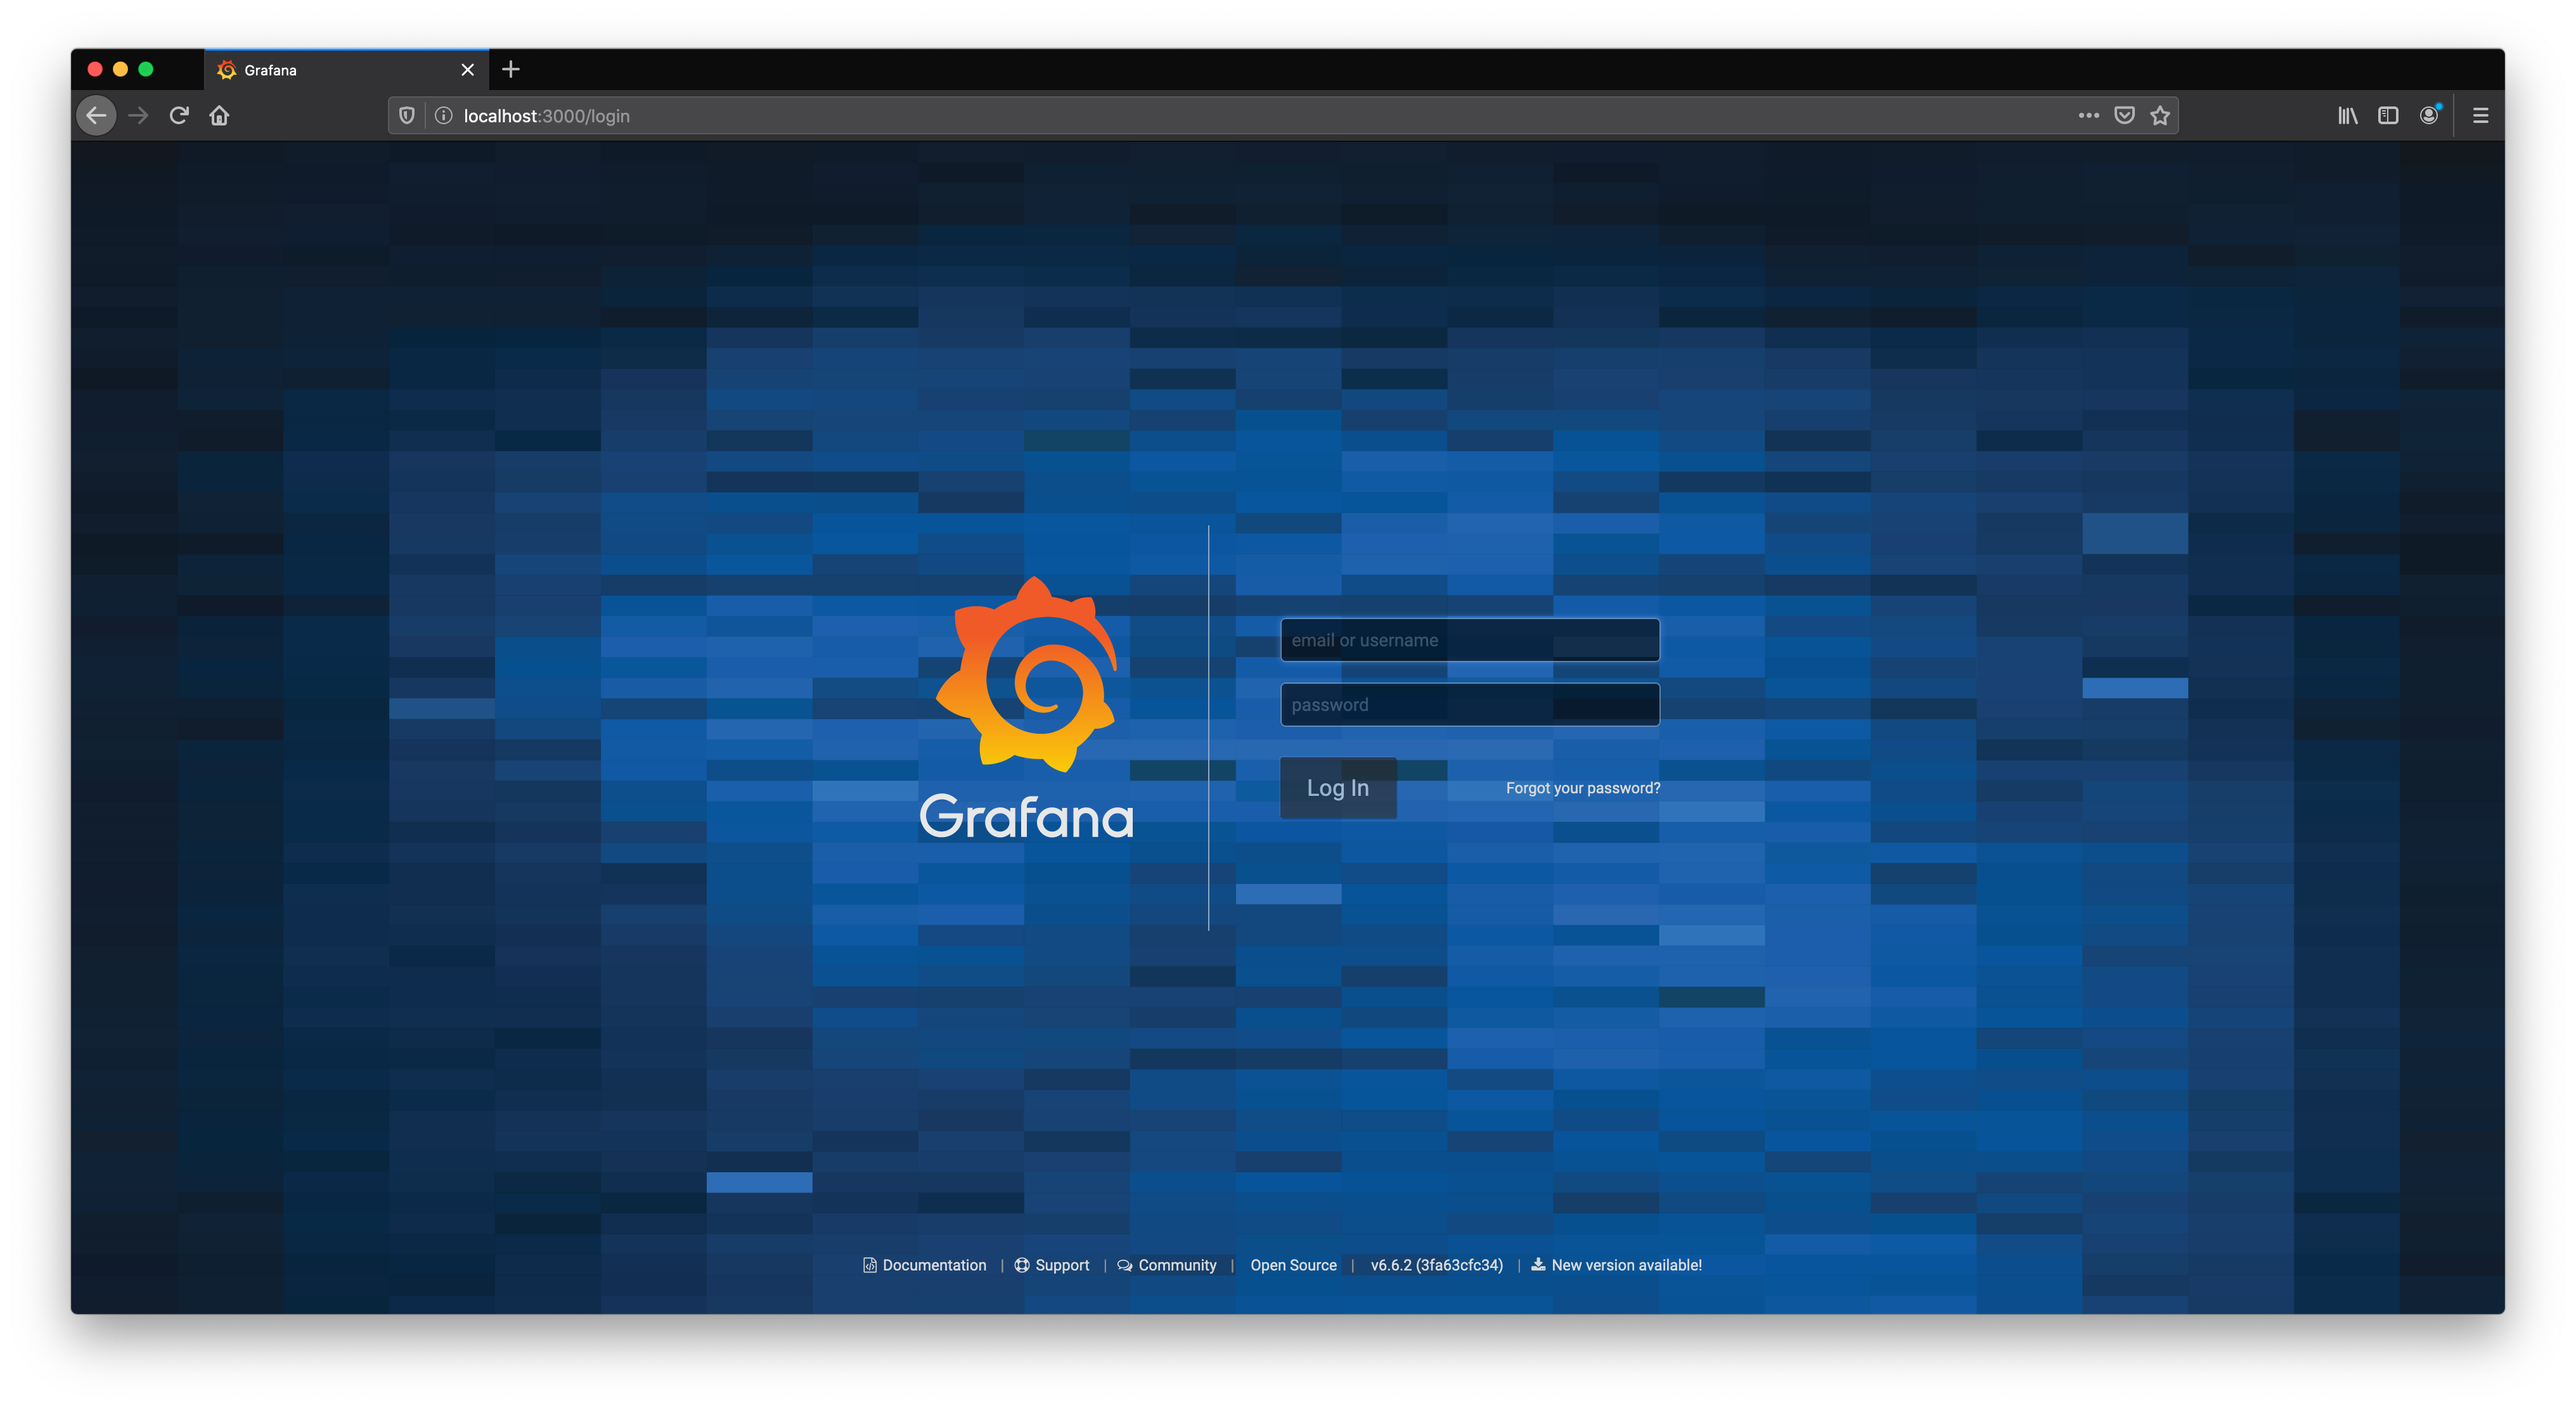
You may be prompted to change the default password, in which case set it to something memorable.
After logging in, you'll want to head to the left-side bar, and select Dashboards > Manage Dashboards
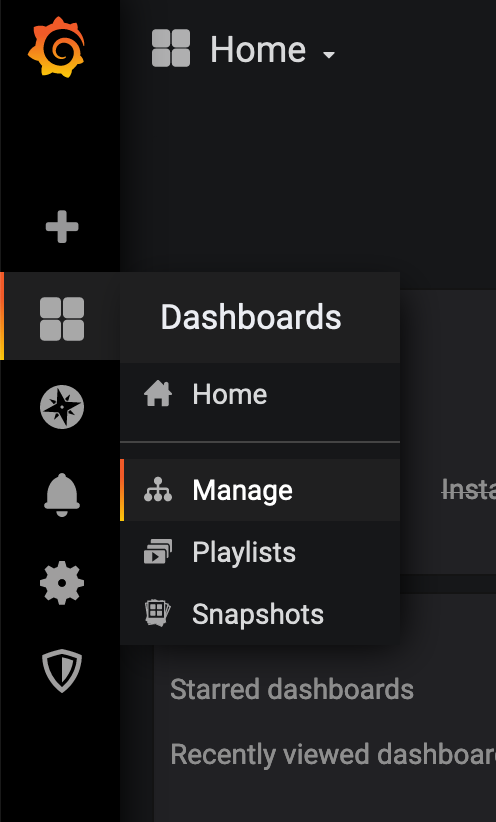
This should present you with a list of dashboards: namely one for each service.
Right now we only have one dashboard for our ExampleService:
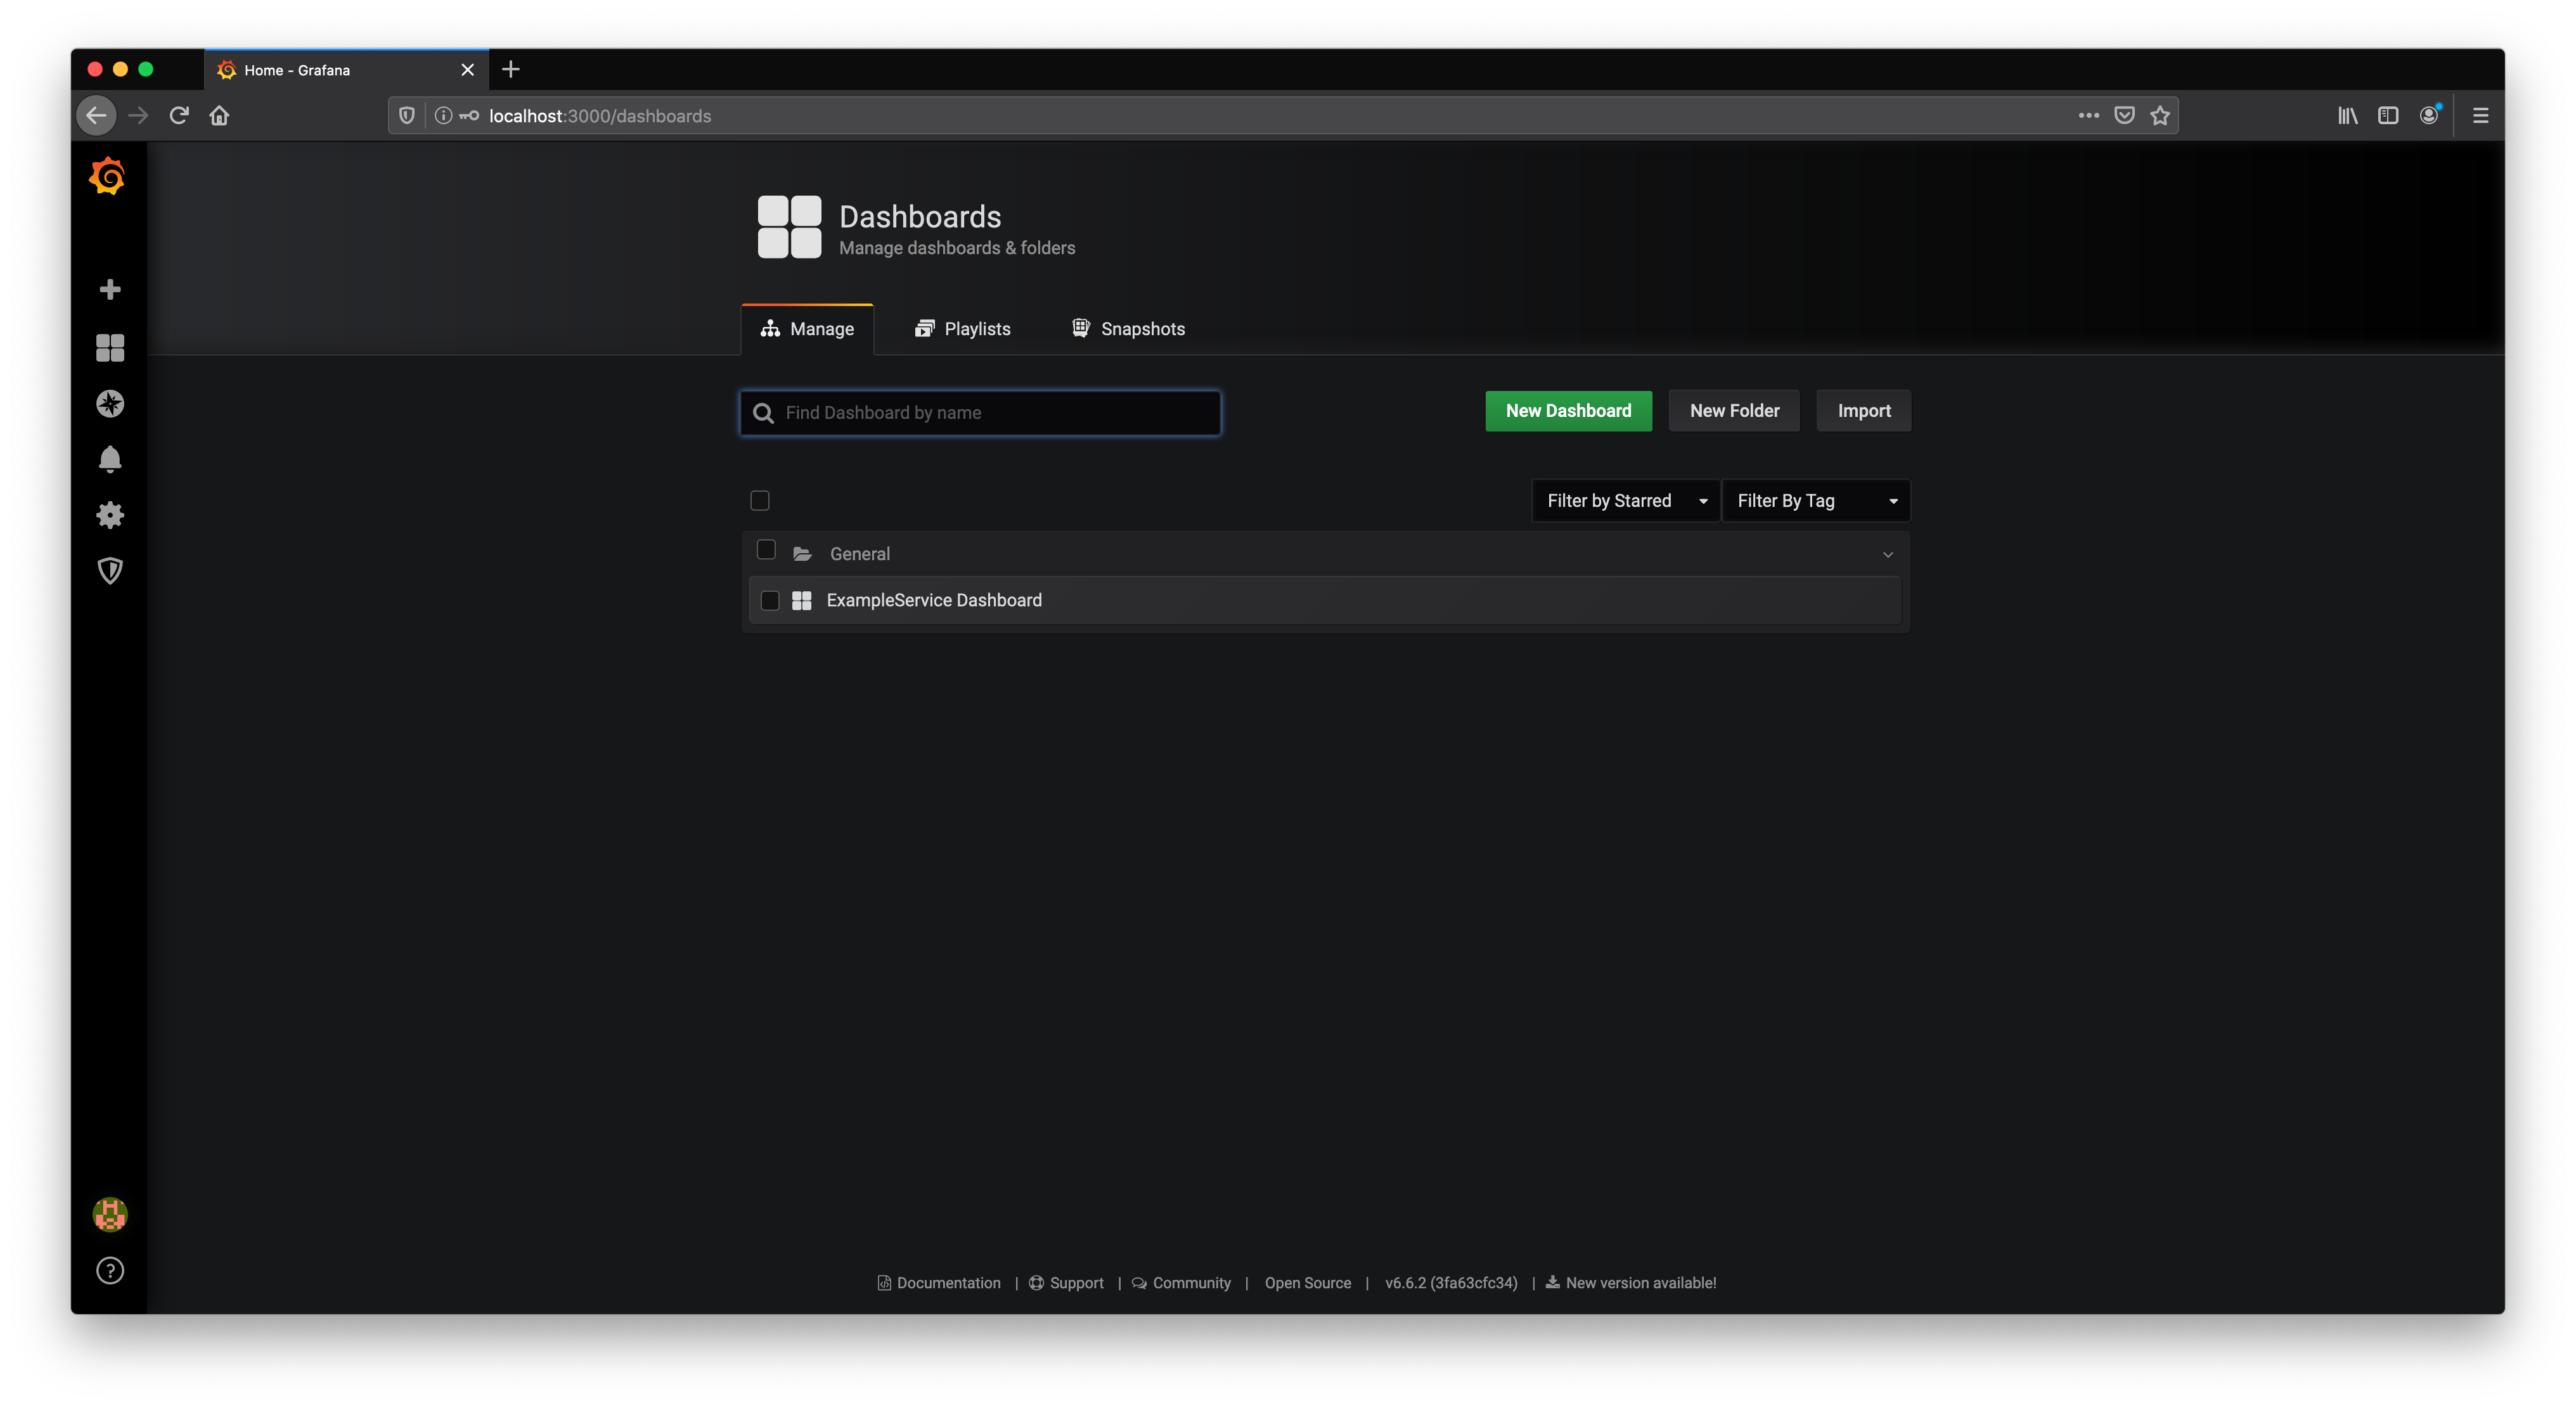
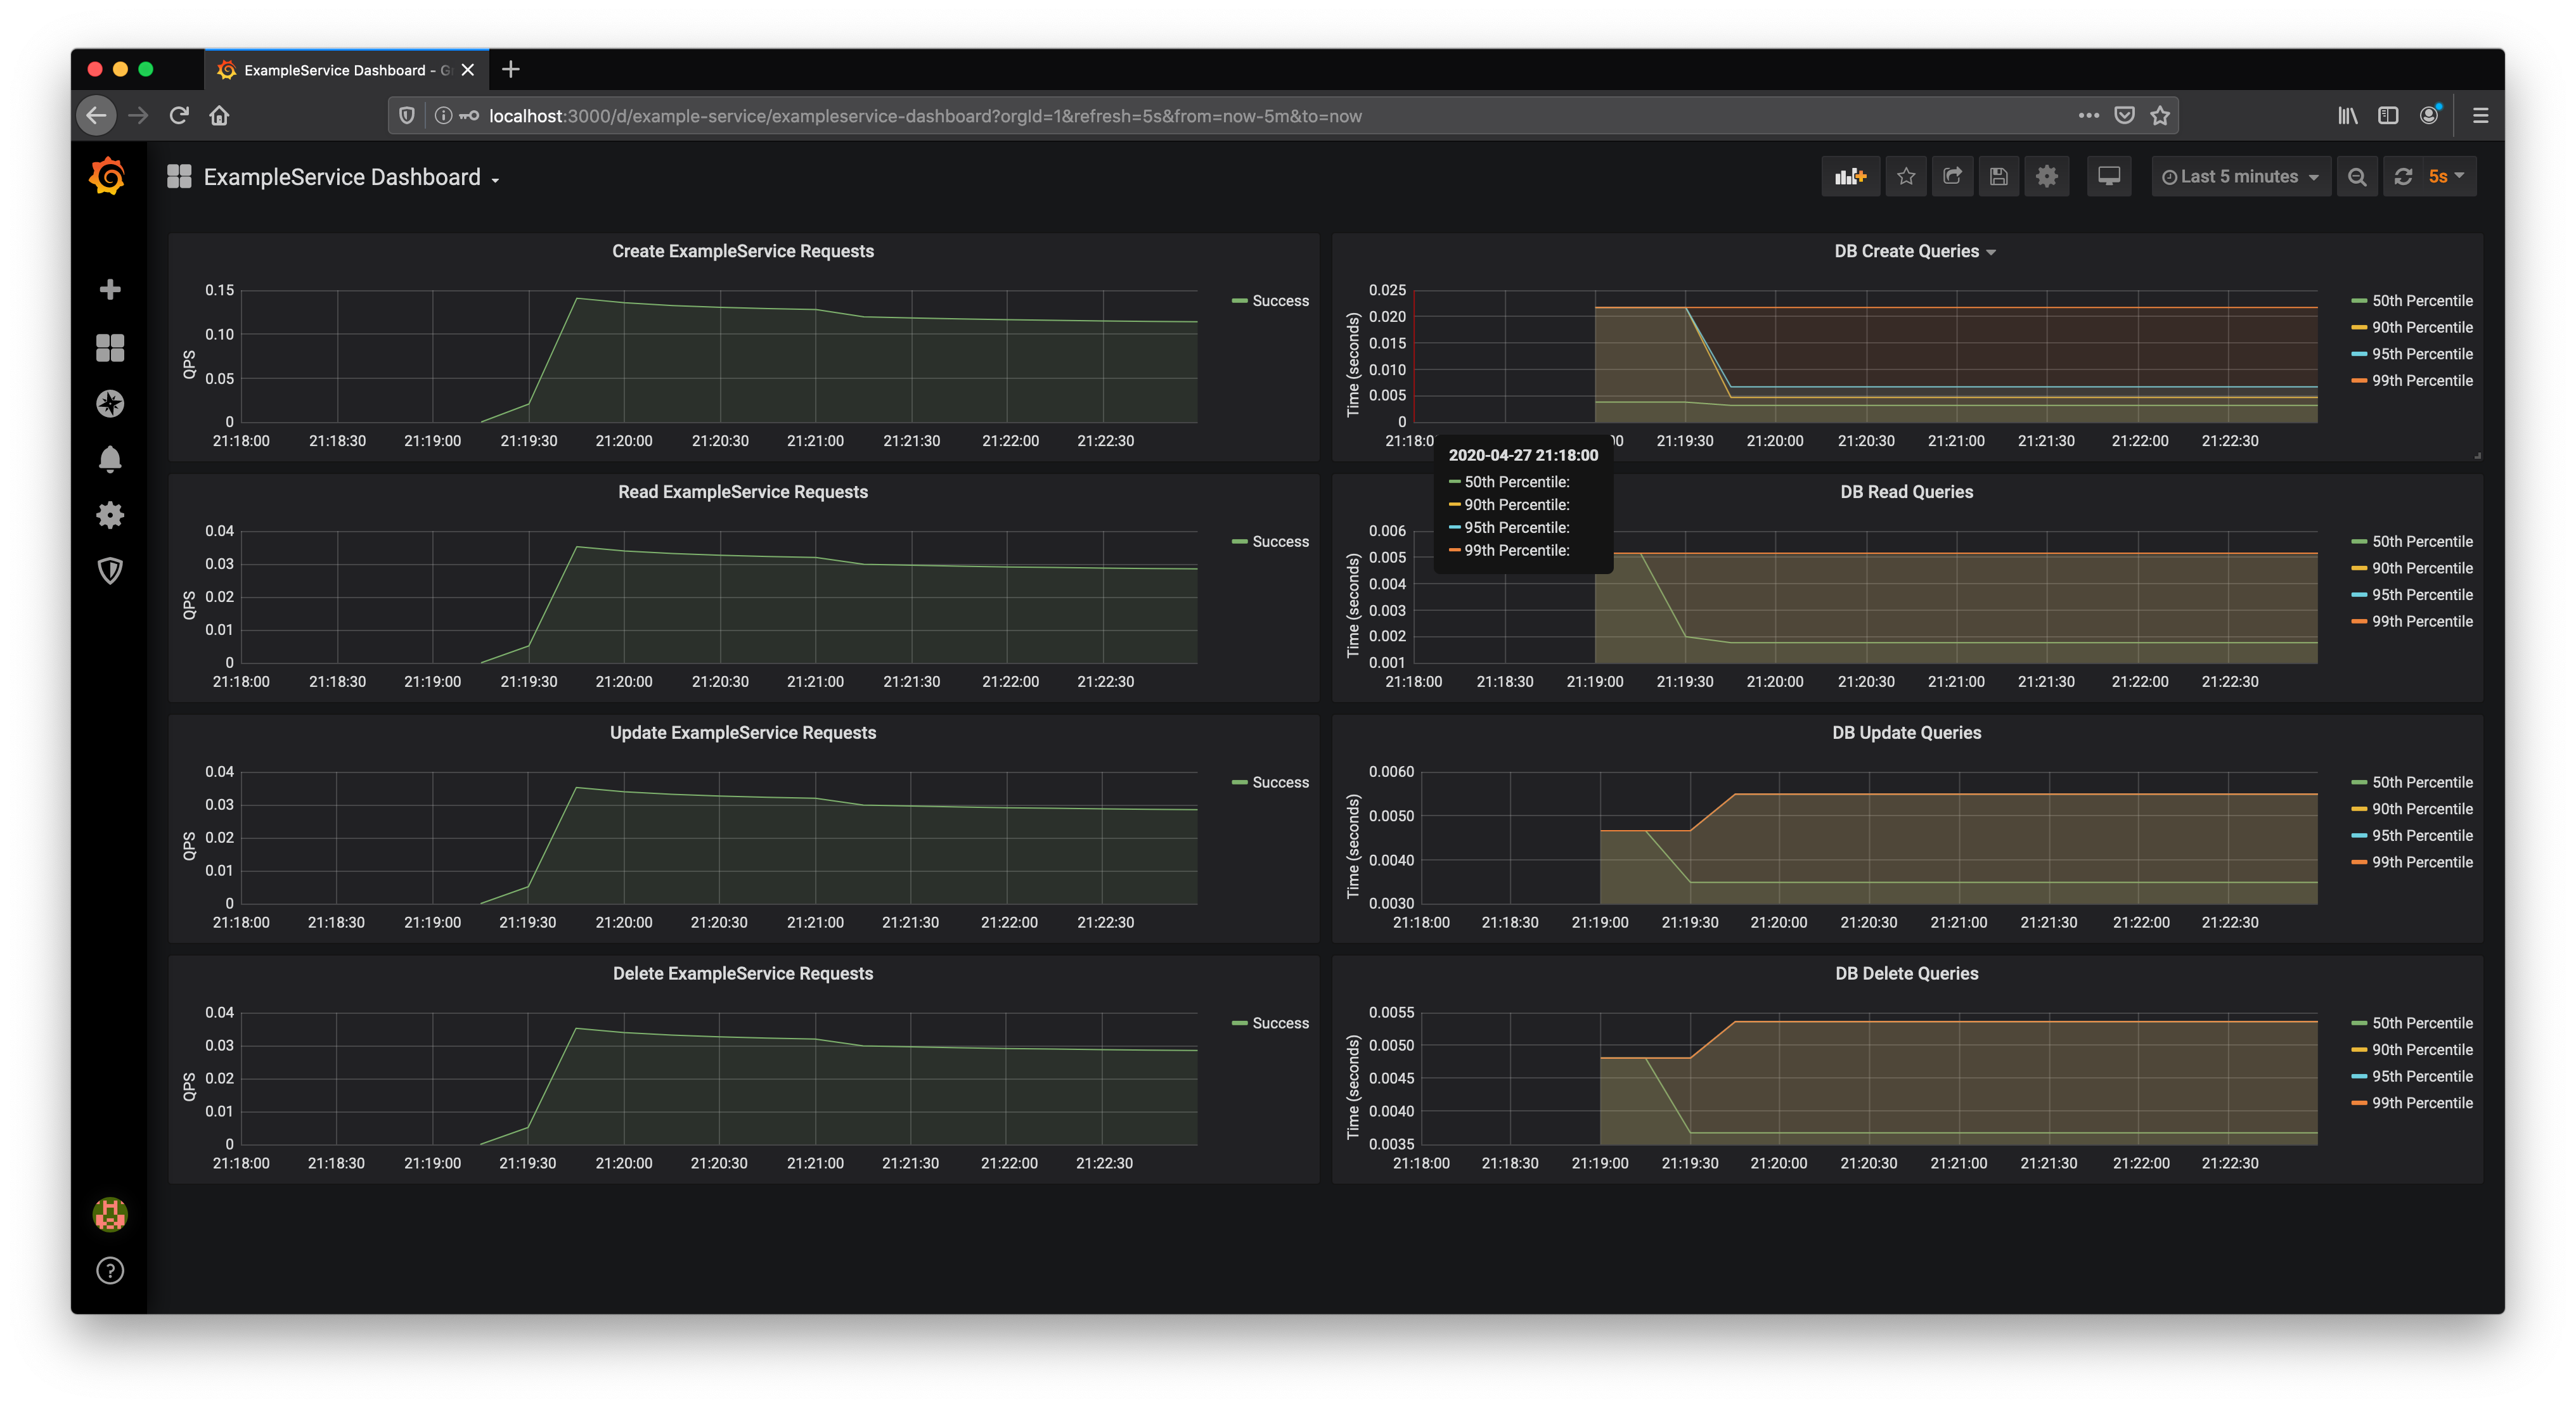
Let's open it up and see what panels are generated:
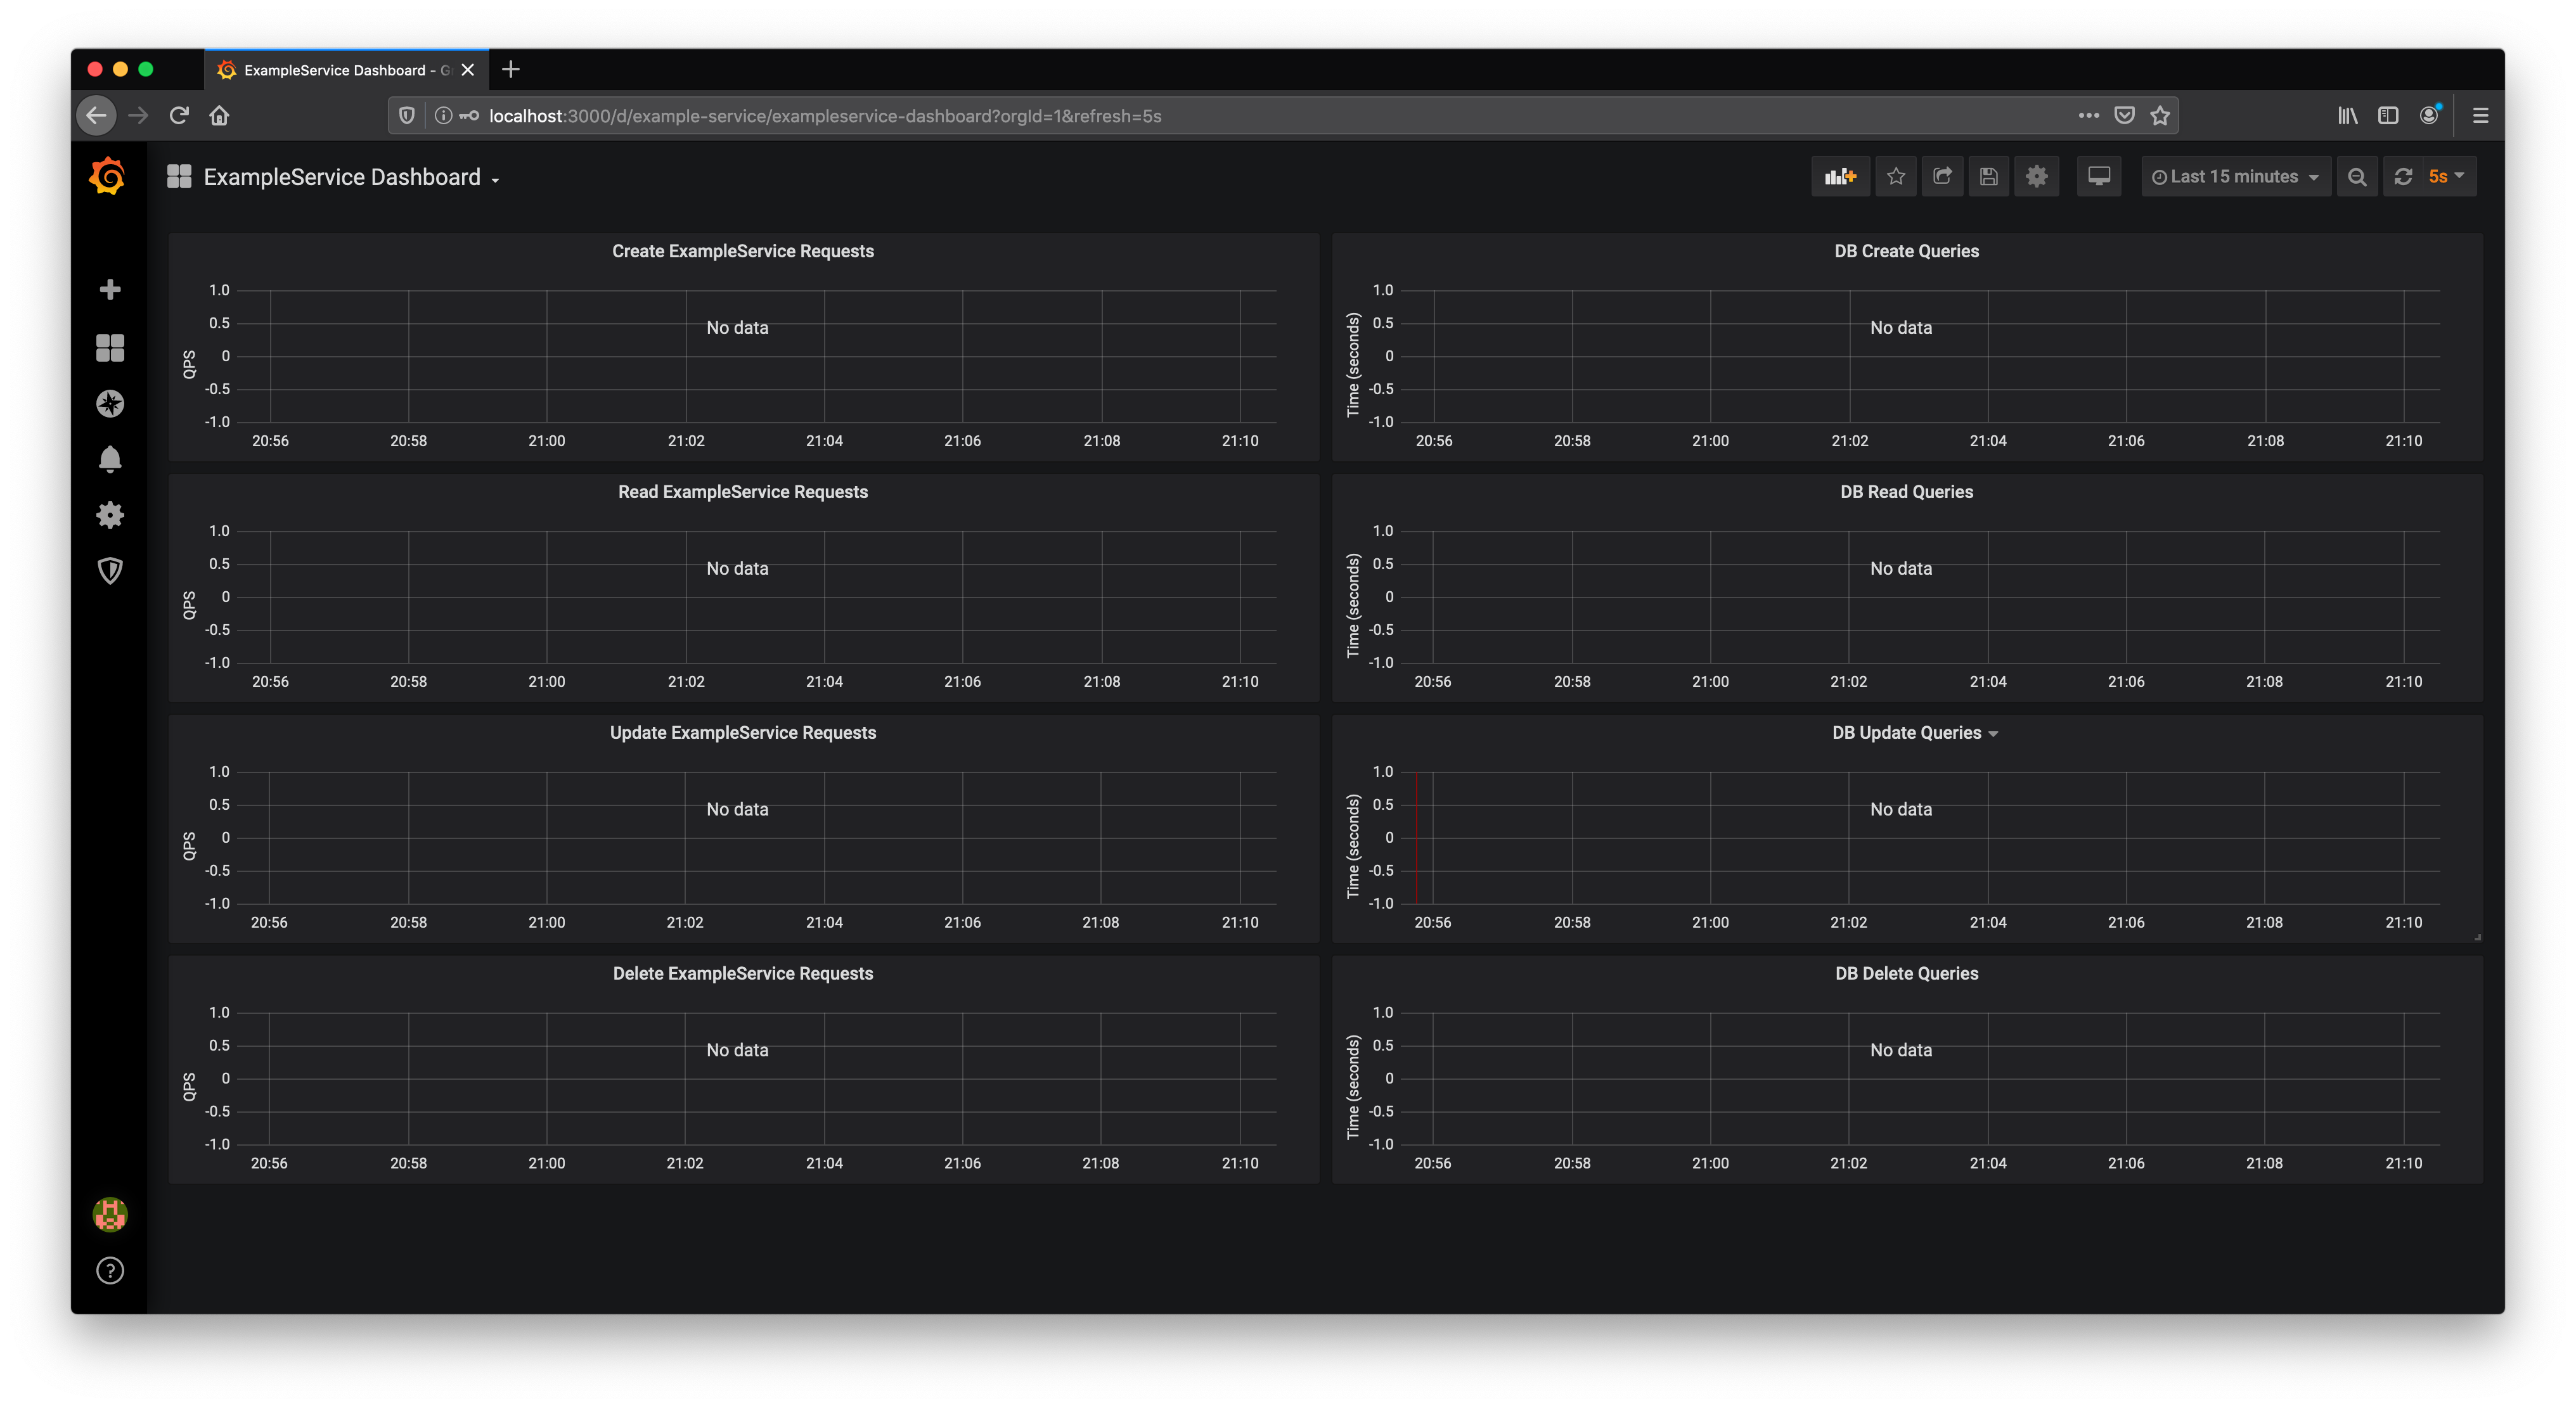
You'll see there are 8 panels here: two for each endpoint. We use one panel to show successful and failed requests, and the other to show latency of database queries broken down into 50th, 90th, 95th and 99th percentiles. However, we currently don't have any data to show in this dashboard, because no tests have been made.
Automating Requests
You could now start making some manual requests to your service and see the associated metrics pop up on each panel. However, we've built an automated request tool directly into Temple, allowing you to mock requests from end users.
To do this, we're going to be using the temple test command.
As explained in the Temple Test guide, temple test has two main operating modes:
- Testing including spinning up and then destroying the associated infrastructure
- Testing without touching the infrastructure
In this guide we're going to be using the second mode.
To invoke this, we're going to use the following command:
❯❯❯ temple test --testOnly example.temple🧪 Testing ExampleService service✅ ExampleService create✅ ExampleService read✅ ExampleService update✅ ExampleService delete🎉 Everything passed
You can run that as many times as you'd like, and after a few seconds you should start to see metrics appearing on the dashboard!
Under the Hood of Metrics
There's a lot going on behind the scenes to make metrics work this seamlessly:
- Each Go service starts an additional HTTP server that exposes Prometheus metrics
- Prometheus periodically scrapes each HTTP endpoint for the data, and forwards this to Grafana
- Grafana then displays this data using queries defined in PromQL
Prometheus Metrics
We expose 3 different types of metrics from each service:
- A counter of successful requests
- This is named
${service}_request_success_total - The request type is provided as a label named
request_type, so that you can both aggregate and split all successful requests as desired
- A counter of failed requests
- This is named
${service}_request_failure_total - The request type is provided as a label named
request_type, so that you can both aggregate and split all failed requests as desired
- A summary of database request durations
- This is named
${service}_database_request_seconds - The query type is provided as a label named
query_type, so that you can both aggregate and split all database requests as desired
The exposed Prometheus counters for your ExampleService can be found in example-service/metric/metrics.go.
The underlying PromQL queries in Grafana display this data by considering the rate of change over the last 5 minutes.
For example, the successful create requests are plotted as:
rate(exampleservice_request_success_total{request_type="create"}[5m])